 |
YATiSh
Yet Another TIme SHeet
|
 |
YATiSh
Yet Another TIme SHeet
|
Time series for panel #3 using wxMathPlot. More...
#include <yatishPlot.h>

Public Member Functions | |
| yatishMathPlot (wxWindow *, yatishDBsqlite *) | |
| void | PlotData (ClusterType, AggregateType) |
| Plotting interface for yatishFrame: More... | |
 Public Member Functions inherited from yatishPlot Public Member Functions inherited from yatishPlot | |
| yatishPlot (yatishDBsqlite *) | |
| The constructor of yatishPlot: More... | |
| virtual | ~yatishPlot () |
| void | SetFirstDay (const wxDateTime &dt) |
| void | SetLastDay (const wxDateTime &dt) |
| virtual wxString | TotalFormatted () |
Private Member Functions | |
| void | SetRangeX () |
| void | ClearCurves () |
Private Attributes | |
| mpFXYVector * | vector1 [3] |
| mpFXYVector * | vector2 [3] |
| mpScaleX * | Xaxis |
| mpScaleY * | Yaxis |
| mpInfoLegend * | legend |
Additional Inherited Members | |
 Protected Member Functions inherited from yatishPlot Protected Member Functions inherited from yatishPlot | |
| void | GetWeekRange (unsigned int &, unsigned int &) |
Computes the week numbers corresponding to members firstDay and lastDay. More... | |
| void | ComputePie (ClusterType) |
Fills member pieData with data for a pie chart with 4 sectors. More... | |
| wxString | TotalFormattedFromPie () |
| Creates a wxString with the total hours in the current pie chart. More... | |
| bool | SelectData (ClusterType, AggregateType) |
Updates vector_Y[3] if need be (for the plotting libraries). More... | |
 Protected Attributes inherited from yatishPlot Protected Attributes inherited from yatishPlot | |
| Map4pie | pieData |
total durations (between firstDay and lastDay), in minutes More... | |
| wxDateTime | firstDay |
| wxDateTime | lastDay |
| AggregateType | formerAggregate |
 Static Protected Attributes inherited from yatishPlot Static Protected Attributes inherited from yatishPlot | |
| static ProcessedData | data |
| weekly times series: various aggregates and clustered sums More... | |
| static string | legends [3] |
| names of the 3 weekly clustered sums, for the current clustering scheme More... | |
| static vector< double > | vector_X |
| epoch time More... | |
| static vector< double > | vector_X2 |
| week number, counted from the first year in the time series More... | |
| static vector< double > | vector_Y [3] |
| user selected data More... | |
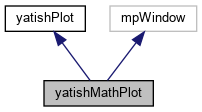
Time series for panel #3 using wxMathPlot.
Definition at line 80 of file yatishPlot.h.
| yatishMathPlot::yatishMathPlot | ( | wxWindow * | p, |
| yatishDBsqlite * | pdb | ||
| ) |
Definition at line 333 of file yatishPlot.cpp.
|
privatevirtual |
Reimplemented from yatishPlot.
Definition at line 401 of file yatishPlot.cpp.
|
virtual |
Plotting interface for yatishFrame:
| [in] | clusters | the clusters to compute and show; default: none |
| [in] | aggregate | if clusters are not used, the aggregate to show; default: hoursTotal |
runtime instability when clusters == tools or when switching back from pie chart (debug mode), although no problem was debugger detected in ComputePie() nor ClusteredSeries()
default plot (timeSeries/hoursTotal/none) sometimes empty when changing library in settings (need to play with aggregate choice to recover it)
Implements yatishPlot.
Definition at line 362 of file yatishPlot.cpp.
|
privatevirtual |
Reimplemented from yatishPlot.
Definition at line 396 of file yatishPlot.cpp.
|
private |
Definition at line 88 of file yatishPlot.h.
|
private |
Definition at line 85 of file yatishPlot.h.
|
private |
Definition at line 85 of file yatishPlot.h.
|
private |
Definition at line 86 of file yatishPlot.h.
|
private |
Definition at line 87 of file yatishPlot.h.